2. Speakers as a system - www.hifilounge.eu
Main menu:
- Home
- General
-
Speakers
- Basics
- Speakers
- Headphones
- Subwoofer
- Elektronics
- Surround
- Photography
- Infos
2. Speakers as a system
Speakers > Speakers
In this section of the homepage, the speaker is regarded as a system. The resulting descriptions and measurements can often be found in the loudspeaker tests - so we will discuss them in detail here.
On one side of the chain there is an electrical signal, on the other side there is a test microphone or the human ear to receive the signals of the loudspeaker in the form of sound. The transducer is a pure transmission element and is subject to the rules of classical signal theory - and can be described accordingly by impulse response, phase response or frequency response.
What do these words mean and why are these things important?
Dirac and the wine glasses
The most basic test signal to analyze a transmission system in classical signal theory is a Dirac pulse. This impulse, named after the mathematician Paul Dirac, is an extremely short-term impulse peak.
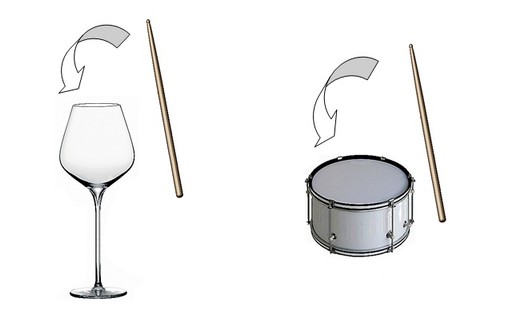
Figure 1: Mechanical Dirac impulse on wine glass and drum
If such an impulse is given in mechanical form, i.e. in the form of a short impact with a hard object on a test object, this object emits a sound. In the case of a wine glass this is a bright "Bing", in the case of a drum it is a low-frequency roar. The test objects are completely passive when exposed to the impulse and can do nothing but swing out at the resonance frequency on which the object is based. The fact that this happens with different frequencies has a simple but far-reaching significance: The Dirac impulse contains both frequencies. No matter whether the reader strikes a table, a piece of sheet metal or a triangle - each test object reproduces the Dirac in its own way. So that the Dirac can excite each object differently, it must consist of all (!) frequencies. The proof is even possible in everyday life: No matter what you knock on, everything sounds different.
With the help of the Fourier transformation, this thought can be formulated in mathematical detail: The Dirac has a spectrum of 1 at all frequencies. That means it consists of all frequencies in equal parts, no matter if 50Hz, 1000Hz or any frequency in between, above or below - it is 1.
Logically, the Dirac pulse is ideally suited to test and fully characterize the transmission behavior of a functional unit of a hi-fi system - such as an amplifier or a loudspeaker. After all, we get an answer here about all the frequencies the loudspeaker can reproduce!
For the measurement of a loudspeaker it is of course not knocked off with a hammer - instead an extremely short electrical impulse is given to the terminals of the loudspeaker.
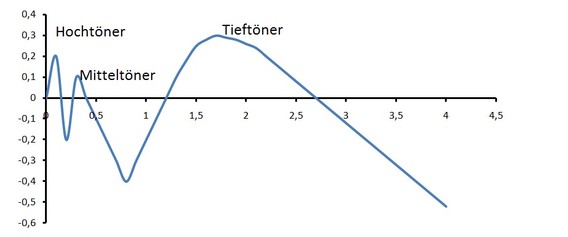
Figure 2: Impulse response of a three-way loudspeaker
Figure 2 shows a 3-way loudspeaker's response to such an impulse recorded with a microphone. The tweeter can reproduce high, i.e. rapidly changing frequencies. Logically, it reacts first to the Dirac. The crossover of the midrange driver contains the highest frequency components before the midrange driver - so the response of the midrange driver is slightly delayed. The woofer receives only the slowest vibrations from the crossover and responds last.
The shown measurement completely characterizes the transmission behavior of the loudspeaker (except for non-linearities).
- Every overshoot, no matter how small
- Every resonance, no matter how tiny
- Any membrane resonance
- any drop in the frequency response
- ...is contained in the impulse response.
This certainly sounds interesting, but how do you assess such an impulse response?
The number of paths of the loudspeaker is easy to guess thanks to the three oscillators marked separately in the diagram - the loudspeaker is a three-way loudspeaker. A two-way speaker would have a hump less in the impulse response. High-frequency resonances would also be recognizable, they would "modulate" an oscillation onto the shown curve. The length of the decay process can be used to deduce how deep bass the loudspeaker can produce...
But let's be honest: the presentation is anything but clear. The layman and mostly also the professional is not able to understand such a measurement. For the hearing unimportant characteristics, like e.g. a bad phase response, look optically horrible in the impulse response - a completely bent frequency response is hardly to be recognized however (although mathematically present).
If you want to evaluate such a measurement curve sensibly, you need a kind of translator - and this translator exists: Fourier.
Fourier as translator
A person can look at an image through normal glasses or sunglasses. The impression of the picture changes, the picture remains the same. Alternatively, there are night vision glasses, glasses to protect against snow blindness, glasses that filter certain colors... None of the glasses affects the object being viewed, but each has its advantages in some situations. Who wants to walk around in the dark with sunglasses? The night vision device would make more sense here...
The time domain (in which the impulse response was also displayed) is the most vivid and instinctive way of imagining a signal. Below the so-called "flicker limit", this description is also correct: At very low frequencies, man was never sound as periodic, time-varying air pressure fluctuations - and thus as the signal is described in the time domain.
With higher tones, people hear the tones differently - and distinguish between high and low tones. This type of hearing is better described in the frequency domain. Fourier has studied the different "glasses" of frequency and time representation of the same signal intensively: He found that every signal can be composed of sinusoidal oscillations - and can therefore be represented in the frequency domain.
He has thus laid the foundation for modern communications technology.

The representation of sinusoidal functions also makes sense from the point of view of hi-fi technology. People hear high or low tones - i.e. fast or slow oscillating sine tones. A church organ produces a "pure" sound, i.e. consists of a few sinusoidal oscillations. A guitar or a castanet, on the other hand, has an extremely complex sound impression - and consists of many sine waves.
The "basic tone", i.e. the lowest frequency and most dominant sine wave, determines to a large extent how high or low a sound is perceived.
The composition of the high-frequency sine waves (the so-called harmonic spectrum) he recognizes the timbre and can distinguish a guitar from a triangle.
The composition of the high-frequency sine waves (the so-called harmonic spectrum) he recognizes the timbre and can distinguish a guitar from a triangle.
*click* The details of time and frequency are explained here *click*
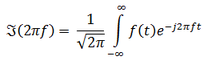
Fourier has left behind a helpful, albeit somewhat unwieldy formula (=glasses) with which signals can be transformed from frequency to time domain. The Fourier transformation named after him or the inverse Fourier transformation. The corresponding formula then looks as follows:
Calculating with the equation requires basic knowledge of higher mathematics, a short explanation of the formula, however, I do not want to remain guilty at this point.
- The left side of the signal is the Fourier transform of the signal in the frequency domain, the expert speaks of the "spectrum" or "spectral range". This spectrum consists of the sum of all (!) sinusoidal oscillations that make up the signal.
- The sum-thing is packaged in the equation in the form of an integral - the crooked line left of the f(t).
- If a simple sum is hidden in this unwieldy operator, it is no wonder that the sinusoidal oscillations also get a rather strange-looking clausulation. This consists of the e term which carries a "-j2πft" in the exponent.
- The time domain signal which should be viewed through another pair of glasses is the "f(t)".
For complex signals the equation is quite unwieldy even for mathematically trained persons. Therefore there is a Fast Fourier Transform (FFT) which can be calculated by computer software. This function is implemented in many programs, even e.g. Excel has a possibility for a corresponding data analysis.
Impulse response + glasses = frequency response
If the Fourier transform is applied to the step response, the so-called complex frequency response is obtained. The impulse response in the time domain is a mathematically complete description of the signal theoretically considered system, the complex frequency response is also a complete system description.
Unfortunately, it is virtually impossible to map the complex frequency response. The complex frequency response gets quite exotic properties - e.g. negative frequencies. And it contains complex frequency components. Complex numbers result if one takes the root from negative numbers - which a commercial calculator immediately acknowledges with an error message, but is actually calculable. These complex numbers contain the phase response, i.e. the temporal shift of the sinusoidal oscillations to each other.
Negative frequencies and roots of negative numbers are at best extremely unwieldy and funny. Even for those who have understood the underlying mathematics.
For a meaningful representation of the complex frequency response, it must be freed from everything that is funny. Mathematically, an amount formation is necessary for this. The result is the so-called amplitude frequency response which describes the loudspeaker in a highly accurate and easily understandable way.
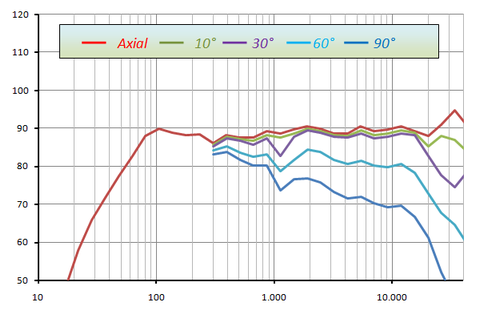
Figure 3: Amplitude frequency responses of a loudspeaker in different radiation directions (axial = forward)
The amplitude frequency response describes the response of a loudspeaker to a Dirac pulse in the frequency domain. The spectrum of a Dirac is a straight line. The measured loudspeaker is (axially) a relatively straight line at least between 100Hz and 20,000Hz. Below 100Hz the loudspeaker drops off which means an error in the reproduction (= bass weakness). The slight waviness of the frequency response is also an error (over- and underemphasis of individual frequency ranges, tonal discoloration).
The sideways radiated sound of loudspeakers at high frequencies clearly falls away from the ideal (= bundling) is representative for commercially available loudspeakers - and a problem. The reflected sound in normal living rooms is louder than the direct sound from the loudspeaker, therefore a resulting fundamental-heavy discoloration is audible.
The essential statement about the sound of hi-fi systems is: The loudspeaker speaks, the room responds! This mixture is the sound of your system.
The bundled radiation at high frequencies has a clear advantage: there are fewer reflections in the room and the sound image becomes clearer. However, the reflective sound in the room lacks the high tones, so the sound impression is dull. Many materials such as concrete walls or carpets absorb high tones more than low tones. The impression is thus additionally ensiled.
It makes sense to simply raise the tweeter using an equalizer to compensate for this effect. However, the hearing takes the direct incoming sound and the reflections were mostly separated, an accentuation of the tweeter in direct sound would cause an unnaturally shrill sound impression.
A balanced and neutral bundling is desirable - however technically very problematic in the conversion.
Further display forms of the impulse response
Even today, the impulse response is still often recorded with Dirac impulses. When testing the room acoustics of a listening room, professionals often clap their hands to get a first impression of the reverberation. In large concert halls, even alarm guns have been used as Dirac generators with a similar aim. Modern tests of loudspeakers, however, are usually carried out with more complex signals and evaluated with the help of software-supported correlation methods. The measurement signals are much less sensitive to interference - but the goal is still the impulse response.
There are different forms (=glasses) of displaying the impulse response. In the following, some display variants are described and evaluated with regard to their significance. Caution: None of the display variants can describe non-linear behavior!
Impulse response:
- Mathematically complete representation
- Response of the loudspeaker to a Dirac
- Display type: Time domain
- Expressiveness: If the viewer of the diagram cannot perform an FFT in the head very low, other display options are easier to interpret.
Step response:
- Can be derived matematically (integral) from the impulse response
- Display type: Time domain
- Contains the complete information from the impulse response.
- Meaningfulness: Analogous to impulse response: Low because difficult to evaluate
Phase response:
- Display type: Frequency range
- Indicates the degree to which the phases are shifted relative to each other in degrees.
- Completeness of the representation: There are no statements about the amplitude frequency response.
- Significance: Low, the hearing is quite insensitive to phase errors, conspicuities only occur with extremely steep separating crossovers in the midrange, at low frequencies the tonal effects (e.g. by bass reflex) are higher.
Group delay times:
- Can be calculated from the phase response
- Display type: Frequency range
- Completeness of the representation: There are no statements about the amplitude frequency response.
- Indicates the degree to which the frequencies arrive at the listener shifted to each other, but is not given here in degrees but in seconds.
- Meaningfulness: Medium, higher than with phase response. Strong time shifts are particularly noticeable in the bass, where phase shifts, e.g. through crossovers or bass reflex ports, are noticeable due to the bass lagging behind.
Amplitude Frequency Response
- Fourier transform of the impulse response, complex information components are omitted
- Display type: Frequency range
- Completeness of the presentation: incomplete, phase information missing
- Expressiveness: Very high, a strongly aurally correct representation of the impulse response
An dieser Stelle nochmals in aller Deutlichkeit: Innere Phasendrehungen sind weitgehend unhörbar und wirken sich nicht auf die Lokalisierbarkeit und Raumabbildung aus, nur sprunghafte Änderungen der Phase sind hörbar. Phasenfehler sind in den meisten Fällen nur dann hörbar, wenn Mitteltöner und Hochtöner im Übergangsbereich unterschiedliche Phasen haben und es daher zu Interferenzen (Kammfiltereffekten) kommt.
Der Amplitudenfrequenzgang wird auch in anderen Darstellungsvarianten gezeigt, z.B. in der Isobarendarstellung (besser bekannt als Tannenbaumdiagramm). Mehr dazu an anderer Stelle.
Data sheet information of manufacturers
At this point again in all clarity: Inner phase rotations are largely inaudible and have no effect on the localizability and spatial mapping, only jerky changes of the phase are audible. In most cases, phase errors are only audible if the midrange driver and tweeter have different phases in the transition range and interference (comb filter effects) therefore occurs.
The amplitude frequency response is also shown in other display variants, e.g. in the Isobar display (better known as the fir tree diagram). More about this can be found elsewhere.
Data sheet data of common large manufacturers
Loudspeakers are complex technical systems that are not easy to assess in combination with acoustics. Let's look at the anonymized technical data for a 150 Euro/piece floorstanding loudspeaker of a well-known major manufacturer.
- 3 ways bass reflex
- 220 / 450 Watt
- 4-8 Ohm
- 18-38.000 Hz
Is the speaker good? Let's evaluate these points:
- 3-way speakers are still effective in advertising. Was that a technical decision? Would a 2.5 way speaker have been better?
- 450 watts sounds good at first glance. But the question of what happens to the power in the loudspeaker remains unanswered. Does the loudspeaker only get warm at the power input - or can it really reproduce high levels?
- The impedance between 4 and 8 ohms is standard on the market. Any conventional amplifier should be able to handle this.
- 18Hz lower cut-off frequency is fantastic. But what does the speaker do at this frequency? Can a low-frequency whisper just be measured with highly sensitive measuring instruments? Or is the frequency response linear up to this frequency?
- 38,000Hz upper frequency limit sounds sufficient. Usually all frequencies above 20,000Hz are filtered out in CD recordings to avoid aliazing effects when digitizing. What the loudspeaker should do at 38.000Hz remains a mystery
But the real questions are: What happens between 18 and 38,000Hz - how does it sound? To answer to this question we will have to know: What is the frequency response? Distortion values? Radiation behavior? The data sheet does not give us any answers to this.
Let's summarize the offer: A large-series manufacturer supplies a low-cost entry-level loudspeaker for 150 euros. As a 3-way construction, it should also be possible to achieve slightly higher bass levels. Loudspeakers in this price region usually have slightly higher treble and bass to make it easier to jump off the seller's shelf, which is probably the case here as well. For a closer evaluation measurements and/or test listening would be desirable.
If you want to see serious and complete manufacturer's information, please visit the following page
recommended by the manufacturer Neumannl. Under the menu item measurement curves complete measurements of a technically very good loudspeaker can be seen. If the manufacturer handles measurements so freely, you can actually judge the loudspeakers on the basis of the data sheet. More caution is required with brochures in the usual electrical wholesale markets.