2. Sound and hearing - www.hifilounge.eu
Main menu:
- Home
- General
-
Speakers
- Basics
- Speakers
- Headphones
- Subwoofer
- Elektronics
- Surround
- Photography
- Infos
2. Sound and hearing
Speakers > Basics
Sound and The human ear is a receiver for air pressure fluctuations.
At very low tones, below the so-called "flicker limit" of about 10 oscillations per second (unit Hertz, abbreviated Hz), the processing speed of the brain is sufficient to recognize the air pressure fluctuations as such. At higher frequencies, including techno low basses, the brain is too slow. The ear can receive frequencies up to about 20000Hz.
A continuous periodic oscillation, e.g. in a church organ, is perceived as a single tone. You don't notice that the sound changes periodically - the rate of change is taken as the pitch instead.
The eye works in a similar way. The eye does not receive air pressure fluctuations but fluctuations of the electromagnetic field. The frequencies visible to the eye are about 300-800 terra vibrations per second - Terra stands for a number with 12 zeros. With this unimaginable rate of change, it is understandable that humans do not take the fluctuations of the electromagnetic field underlying the light as such - the frequency is taken as the color instead. Similarly, instruments are referred to as timbres.
Two essential parameters influence the hearing sensation. The pitch (frequency) and the volume (amplitude) of the signal. In the following the temporal changes of some signals are shown to illustrate the differences.
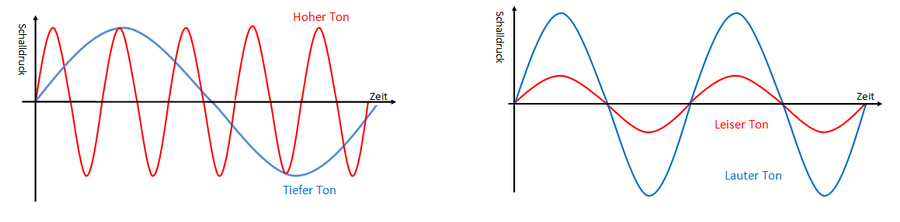
Figure 1: Sinusoidal oscillations with different frequency (left) and amplitude (right)
This representation of signals is called time domain representation or time domain in technical English. The representation is very clear for the listening comprehension of signals below 10Hz (=ultra low bass). Here the human being actually feels several sound pressure fluctuations per second.
At higher frequencies of several thousand oscillations per second, however, the computing speed of the ear can no longer identify the sound as such. At such high frequencies, people hear "differently".
The mathematician Fourier provided a "different" and correct interpretation of sound signals. In his life he came to the conclusion that every (!) signal can be composed of so-called sinusoidal oscillations (as shown in Figure 1). An example of a complex signal is the composition of a square wave signal.
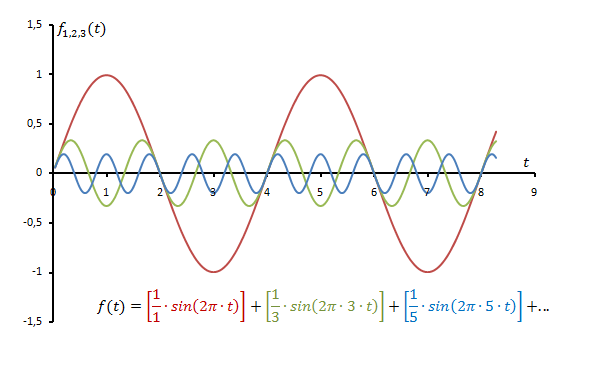
Figure 2: Composition of a square wave signal
Adding different sinusoidal oscillations, as shown above, results in a new waveform. The resulting signal for the low-frequency first 3 differently coloured (red, green, blue) sinusoidal measures results in sum:
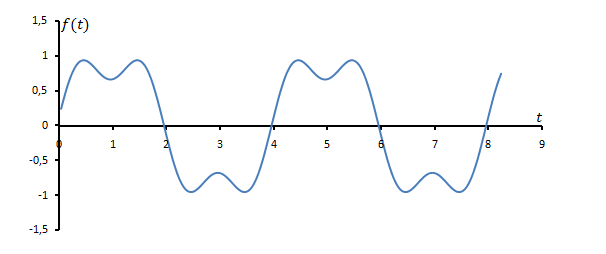
Figure 3: Square wave signal from 3 sinusoidal oscillations
The result is not really rectangular. If the first 25 are used instead of the first 3 sinus men, the result becomes much more rectangular:
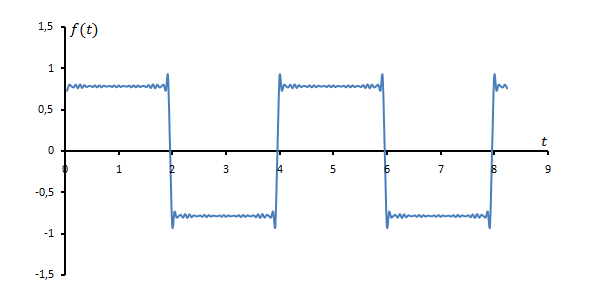
Figure 4: Square wave signal from 25 sinusoidal oscillations
The composition of real music signals works analogously to the rectangle. As an example, the measured frequencies of two instruments (violin and flute) are shown - the frequencies are also referred to as "spectra". Each line in the following diagram stands for a sinusoidal oscillation in the time representation, the sum of the sinusoidal oscillations would give the complete time signal.
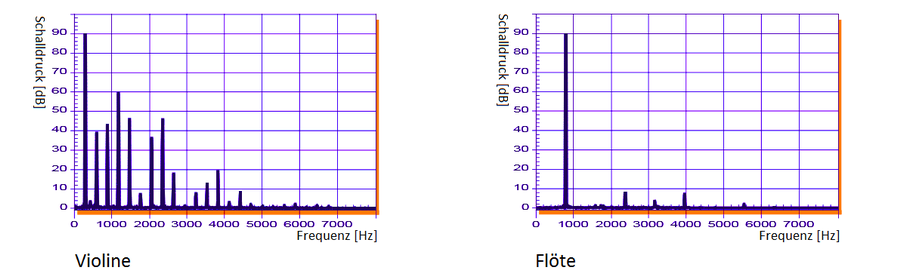
Figure 5: Spectra of violin and flute
Each of the (spectral) lines in the frequency diagrams represents a sine wave - it is common for periodic time signals that the spectrum consists of individual lines. If the time signals change non-periodically with time, the gaps between the signals are also filled.
The flute has only one of these lines at about 800Hz. The sound of the flute therefore sounds very clean and pure. The lowest-frequency line is called the fundamental wave and is dominantly responsible for the perception of the treble.
The violin consists of many more lines, the sound impression is much more complex than with a flute. The fundamental wave is around 200Hz, so the instrument is perceived as lower than the 800Hz flute.
The fundamental waves at both frequencies have a sound pressure of about 90dB - the two instruments are therefore about the same volume.
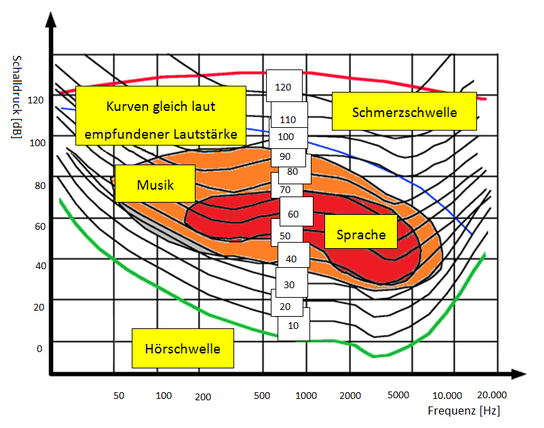
Figure 6: The extended Fletcher-Munson Diagram
The expanded Fletcher Munson Diagram expands the understanding of hearing. The red area shows the usual frequency ranges of spoken language. The basic waves of the speech are mostly below 1000Hz, the rest are harmonics which make up the characteristic timbre of the letters. Music probably covers a larger range. From about 120dB the volume becomes painful and can lead to hearing damage. The green line shows the hearing threshold for soft signals.
As a microphone, the ear is not equally suitable for all frequencies. At frequencies around 3000Hz the hearing is most sensitive, deep bass and frequencies above 20,000Hz the hearing is comparatively quiet. The diagram in Figure 3 therefore shows different curves of equally perceived volume as a function of frequency.
In deep bass, a person can hear the sound with his whole body. The sensation has little in common with the usual "hearing", but to specify a lower frequency limit for the audible frequency range is nonsense. Depending on the age (and the number of disco visits) there is an upper frequency limit. This is usually between 16000 and 20000Hz.